
 Engels

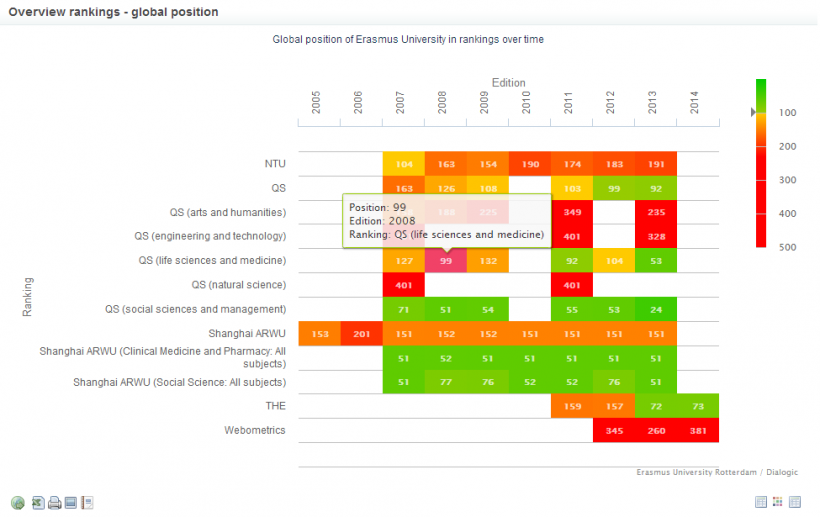
- ERIM Dashboard is a dashboard that shows the scientific input, output and productivity of the Erasmus Institute of Management, the research department of the Rotterdam School of Management (RSM) at Erasmus University. The dashboard is fed with real-time data form the ERIM databases. (Note, not all areas of the dashboard are publicly accessible)
- WTI2 is the portal to indicator data on science, technology and innovation in the Netherlands. It is maintained in partnership with CWTS and NIFU.
Some of our more exciting projects are, unfortunately, not open for public viewing. The project websites however give you an idea:
- The GeefITDoor! project uses the Dialogic Platform to facilitate matching IT professionals with education institutions for guest lectures, mentorships and internships.
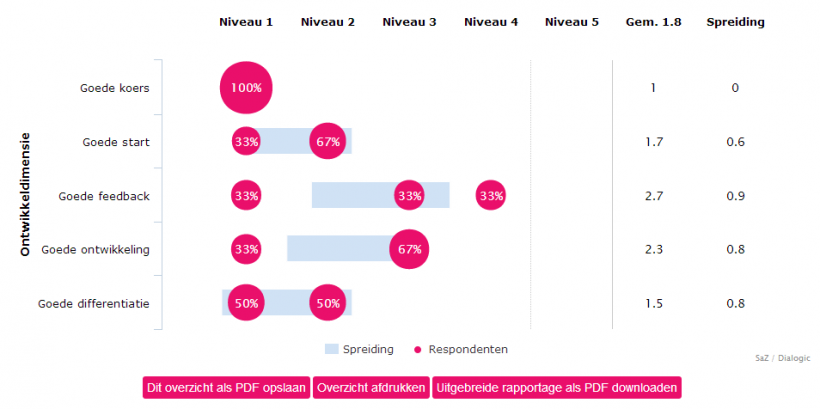
- School aan Zet uses the powerful survey functionaltiy in the Dialogic Platform to manage interaction with over 2300+ participating schools.
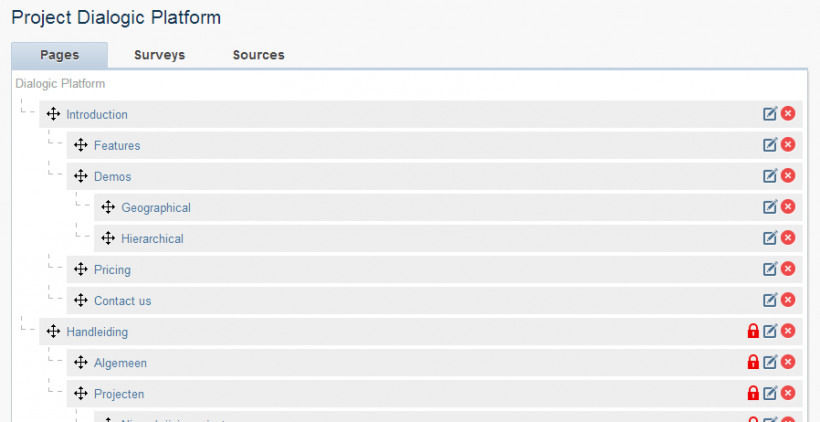
The content management module of the Dialogic Platform allows anyone to create a dashboard website in a few clicks. The interface is completely drag-and-drop.
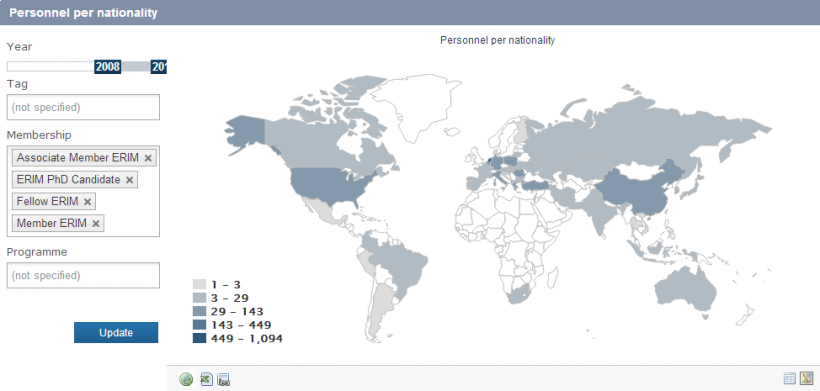
The examples below show different types of visualizations available in the platform for geographical data.
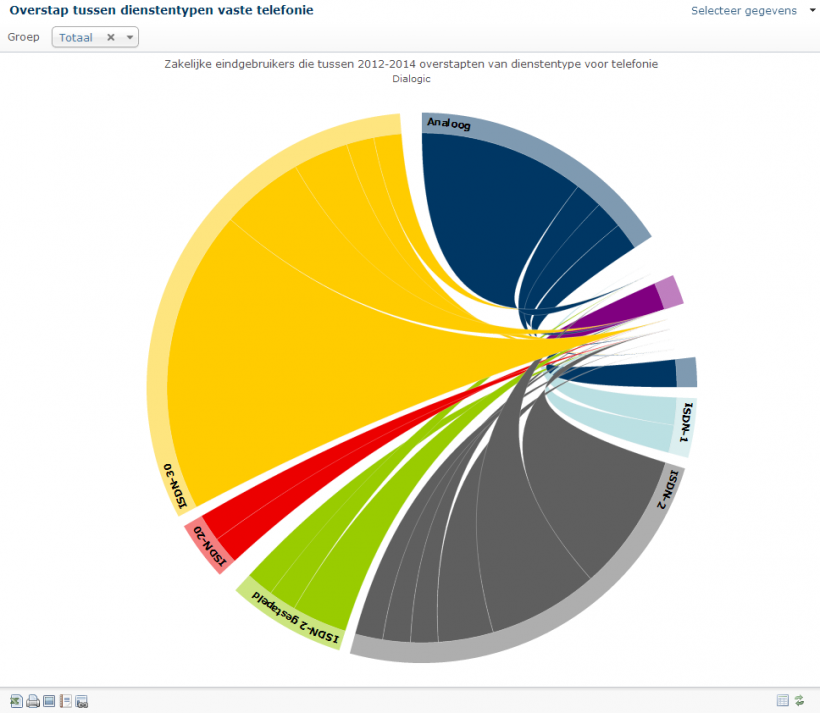
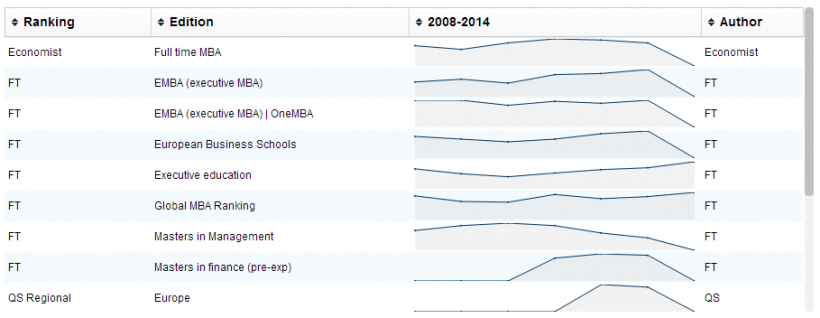
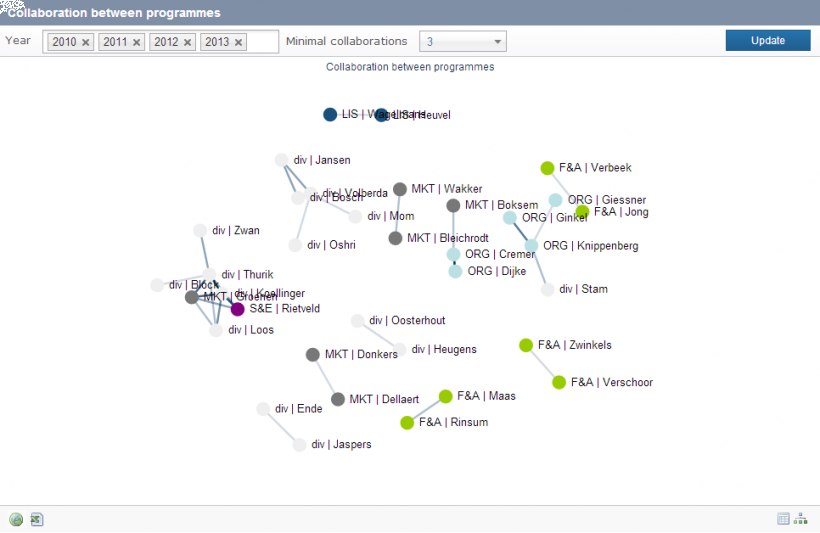
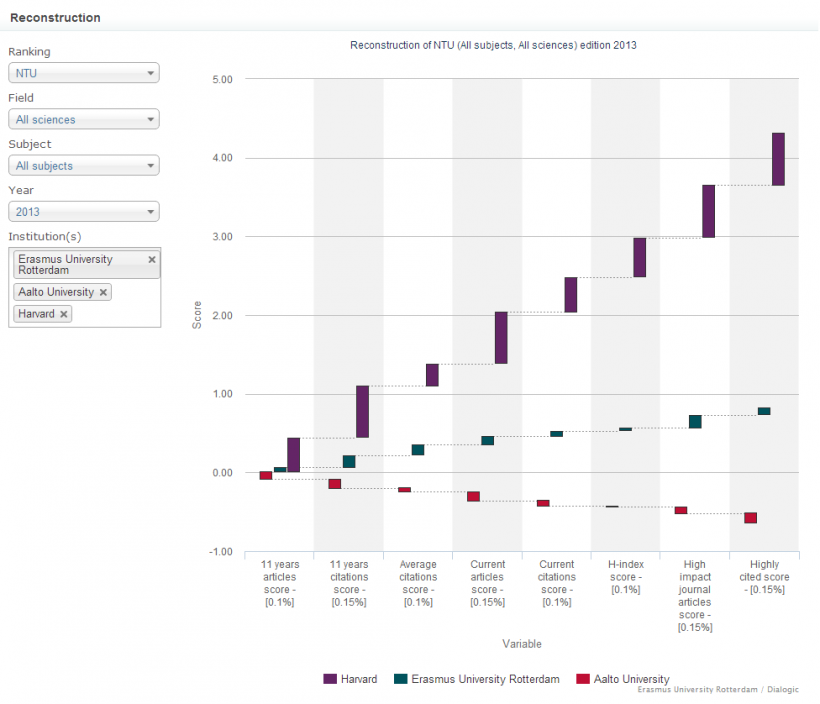
The examples below show different visualizations that are available for hierarchical data in the platform.