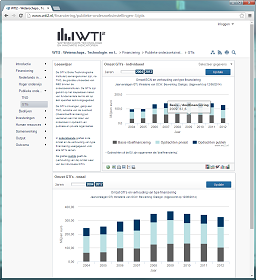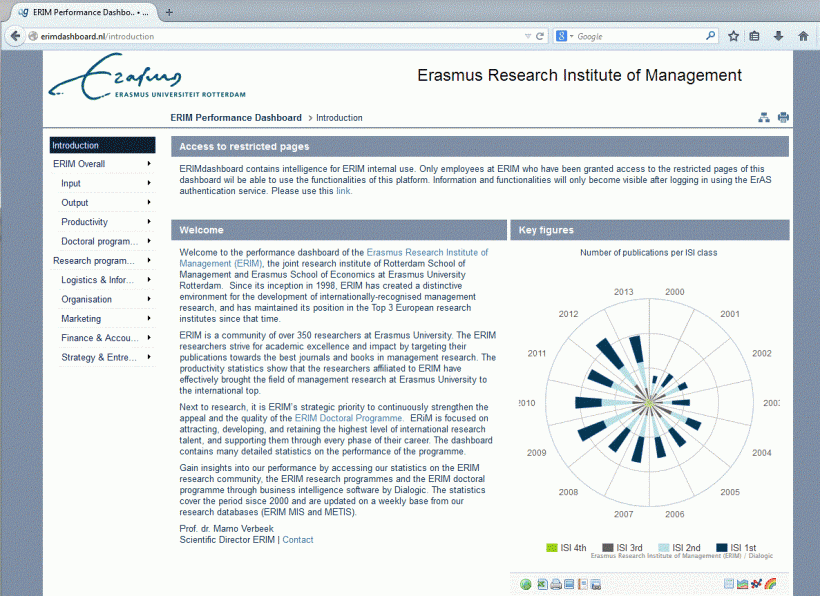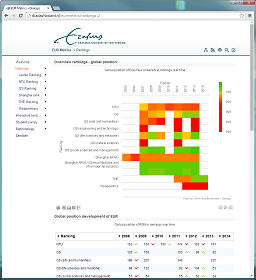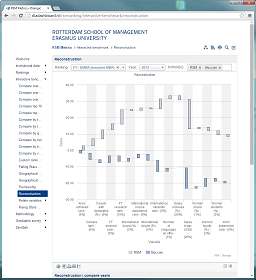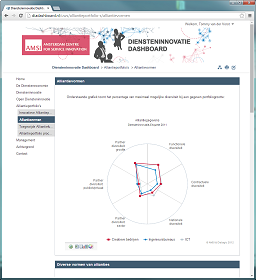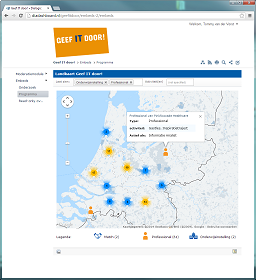
The Dialogic Platform enables you to create and share interactive visualizations of large data sets through an intuitive interface. The Dialogic Platform provides:
- An integrated, real-time workflow for data collection, transformation and presentation
- Open architecture for data exchange and custom visualizations
- High performance on large datasets
- Content management system for the creation of attractive dashboards
The Dialogic Platform is used by Dialogic, a research and consultancy firm based in Utrecht, the Netherlands.
Analysis module
- High-performance calculation engine
- Full integration with MySQL
- Open API for custom data providers
Dashboard/visualization module
- Pattern/role-based user access control
- Element/chart embedding support
- Page permalink support
- Responsive, mobile-ready design
- Pattern-based style rules for data formatting
- Project based custom CSS
- Visualization plug-ins with customizable settings
- Native Highcharts, Google Maps visualizations
- Data export functionality
- Optional social sharing buttons
Survey module
- Panel/mass-invitation support
- Customized/pre-filled surveys
- Complex question types (including matrix questions)
- Pattern-based input validation
- Declarative question routing
- Calculations during data entry
- Secure, unique respondent links
- Real-time analysis of collected data
Back-end
- Multilingual back-end
- Admin roles and permissions by-project
- Intuitive, drag-and-drop interface

 Engels
